What are linear functions?
Value tables - on the way to linear functions
Our example 1:
kg walnuts | 1 kg = 1000g | 100 g | 200 g | 500 g = 0.5 kg | 1.2 kg =1200 g |
Price in € | 4 € | 0,40 € | 0,80 € | 2,00 € | 4,80 € |
In order to easily calculate the prices for 200 g, 500 g and 1.2 kg, it is helpful to first note the price for a small quantity, here for example for 100 g. This is already an example of a table of values for linear functions.
Example 2:
Parking time | 0.5 h = 30 min | 10 min | 50 min | 2h 20min | 6h 15min |
Parking fee | 1 € | 1 € | 1€+1€ = 2 € | 4 x 1€ + 0,75€ = 4,75 € | 7,50 € |
In order to calculate the parking fees, it should be noted that they do not change evenly, but "jump".
Example 3:
Number of eggs | 1 Egg | 2 eggs | 3 eggs | 5 eggs | 10 eggs |
Cooking time in min | 4 min | 4 min | 4 min | 4 min | 4 min |
All eggs are ready at the same time, because all eggs have the same time to be cooked.
Diagrams
The assignments can also be represented graphically in a chart. To do this, the values are drawn in a coordinate system. You can then also read off other values.
The walnut example - our example 1 as a diagram
What does 800 g of walnuts cost? This graphical allocation is already a linear function as a chart!

800 g walnuts cost €3.20!
The car park example - Example 2 as a diagram
What is the price in the parking garage for 1:15 h parking?
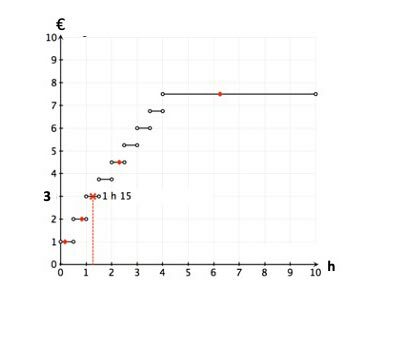
1:15 parking costs €3!
Cooking eggs - Our example 3
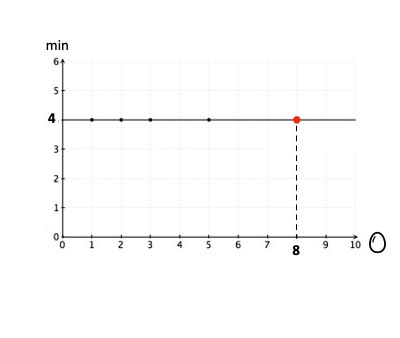
Also 8 eggs have exactly 4 minutes cooking time!
Such assignments are also called functions. With functions, exactly oney value (e.g. y €) is assigned to a certain x value (e.g. x kg).
In a graph , functions are represented by corresponding lines. These are called the graph of the function.
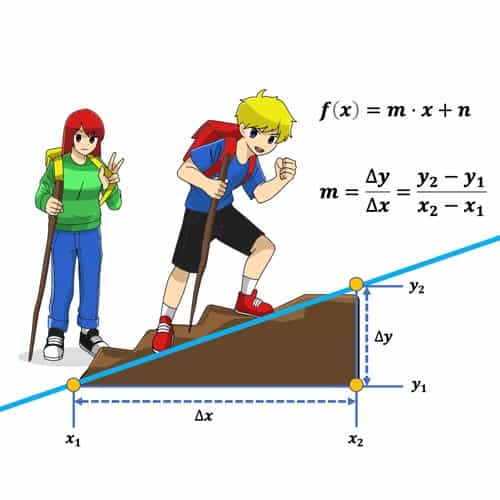
of a linear function
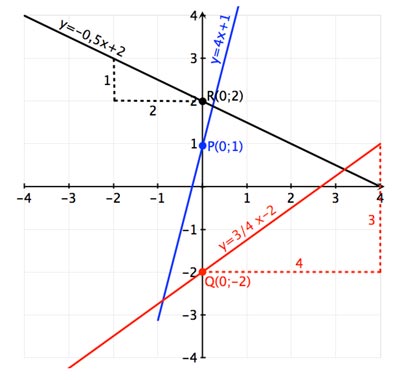
and the y-axis intercept n
of a linear function!